Employment Market Collapse Graphics >>>
PERCENT OF JOBS LOST IN RECESSIONS AND DEPRESSIONS AS OF JANUARY 2011
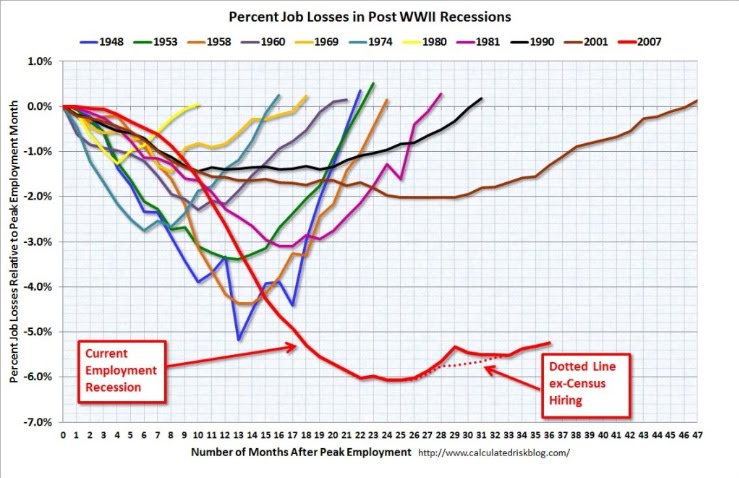
As of January 2011
US EMPLOYMENT AND RATES OF CHANGE 1939 TO PRESENT
Chart of Employment to Population Ratio & Two Other Ratios by CalculatedRiskBlog.com as of Jan 2011
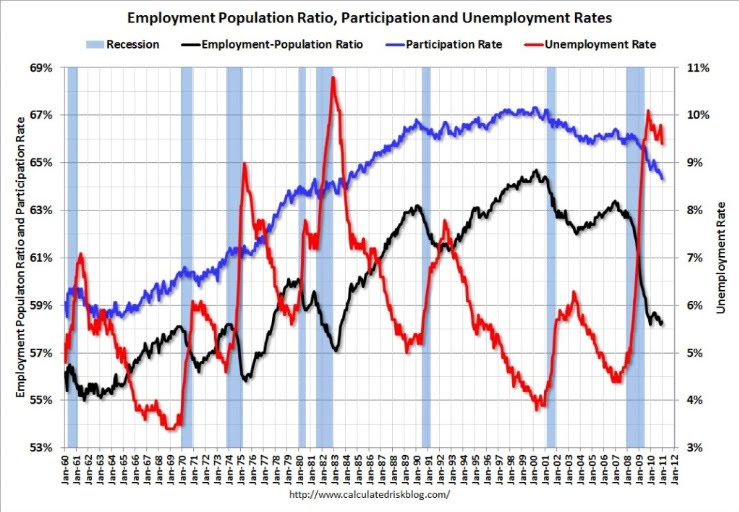
As of January 2011
CHART OF EMPLOYMENT TO POPULATION RATIO AS OF JULY 2010 BY CALCULATEDRISKBLOG.COM
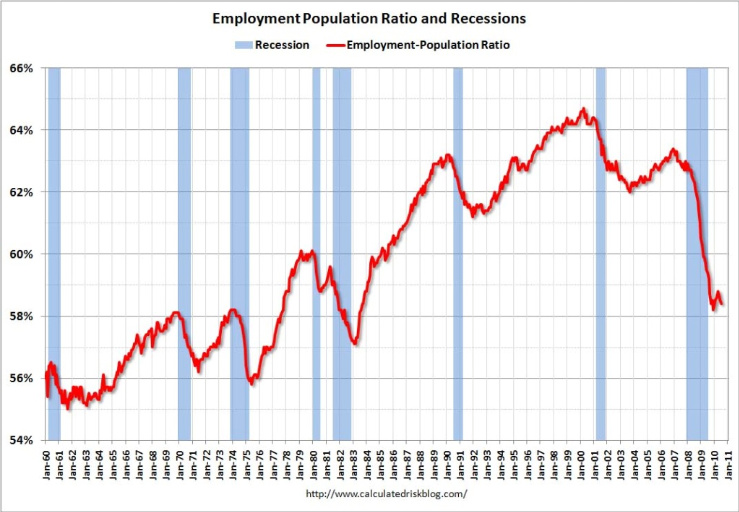
As of July 2010
NOTE REGARDING DELAY IN PERCENTAGE OF POPULATION EMPLOYED UPDATES
Due to technical difficulties at the BLS Site, we have been, as of January 2011, unable to update the all-important percentage of the population employed worksheet (that is just below) for three months and counting. The BLS Current Population Survey is failing to load in either Internet Explorer or Firefox. The information below is as of October 2010. If the problem persists into the Spring of 2011, we will have to get the data from a secondary, third party source.
US EMPLOYMENT TO POPULATION RATIO 1948 TO PRESENT
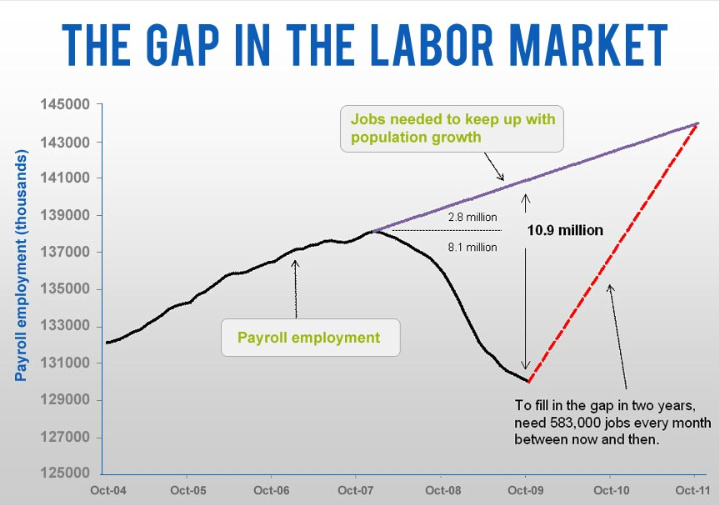
GAP IN THE LABOR MARKET AS OF SEPTEMBER 2010
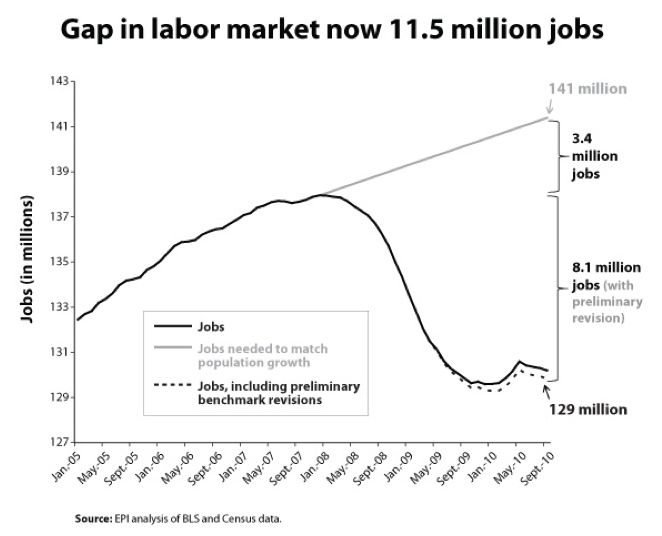
GAP IN THE LABOR MARKET AS OF OCTOBER 2009
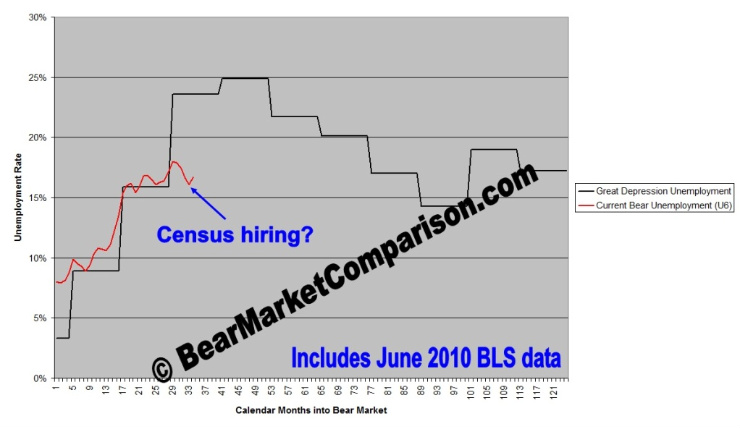
UNEMPLOYED COMPARISON BETWEEN THE TWO DEPRESSIONS
Prices of Key Items Graphics >>>


History of Prices of Key Items >>>
MEDIAN PRICE OF EXISTING HOUSES BY YEAR IN THE USA
Note 1: Sale prices of new homes are irrelevant in this measure ; the prices are for existing homes only.
Note 2: These median prices are NOT inflation or in any other way adjusted.
Note 3: The percentages shown are the percentage change in the median price from the prior year.
2010 $169,300 -0.2%
2009 $169,600 -10.5%
2008 $196,600 -9.8%
2007 $218,000 -1.4%
2006 $221,000 11.6%
2005 $198,000 7.0%
2004 $185,200 9.3%
2003 $169,500 8.5%
2002 $156,200 5.7%
2001 $147,800 6.3%
2000 $139,000 4.3%
1999 $133,300 3.8%
1998 $128,400 5.4%
1997 $121,800 5.2%
1996 $115,800 4.8%
1995 $110,500 3.1%
1994 $107,200 4.0%
1993 $103,100 3.4%
1992 $99,700 2.7%
1991 $97,100 5.5%
1990 $92,000 2.8%
1989 $89,500 0.2%
1988 $89,300 4.1%
1987 $85,600 6.6%
1986 $80,300 6.4%
1985 $75,500 4.3%
1984 $72,400 3.0%
1983 $70,300 3.7%
1982 $67,800 2.1%
1981 $66,400 6.8%
1980 $62,200 11.9%
1979 $55,700 14.2%
1978 $48,700 13.5%
1977 $42,900 12.5%
1976 $38,100 7.9%
1975 $35,300 10.3%
1974 $32,000 10.7%
1973 $28,900 8.2%
1972 $26,700 7.7%
1971 $24,800 7.8%
1970 $23,000 8.0%
1969 $21,300 6.0%
1968 $20,100 NA
1960 $11,900
1950 $7,354
1940 $2,938
CASE-SCHILLER COST OF HOUSING INDEX BY YEAR AND BY QUARTER
These numbers show you the relative cost of housing standardized by (adjusted for) the quality and size of it. Actual prices vary radically from place to place, and changes in prices vary substantially, but the following is the overall average change in prices from quarter to quarter and from year to year since 1987.
This index reflects actual dollar prices, not inflation-adjusted prices. This index itself is showing you both the effect of general inflation on house prices and any change in house prices above or below general inflation.
The index is standardized at 100.00 as of January 1, 2000. For quarters after that, the the difference between the index and 100.00 gives you the total percent change in house prices since January 1, 2000. For example, as of quarter four 2005, house prices were 86.97% higher than they were on January 1, 2000.
For quarters prior to January 2000, if you divide 100.00 by the index value, you can see by how much prices rose from the prior quarter to January 2000.
S & P / Case-Shiller
U.S. National
Year Quarter Home Price Index
2010 Q4
2010 Q3 135.48
2010 Q2 138.03
2010 Q1 132.20
2009 Q4 136.07
2009 Q3 137.57
2009 Q2 133.24
2009 Q1 129.23
2008 Q4 139.43
2008 Q3 150.49
2008 Q2 155.95
2008 Q1 159.36
2007 Q4 170.75
2007 Q3 180.01
2007 Q2 183.17
2007 Q1 184.83
2006 Q4 186.44
2006 Q3 188.11
2006 Q2 189.93
2006 Q1 188.66
2005 Q4 186.97
2005 Q3 183.08
2005 Q2 176.70
2005 Q1 169.19
2004 Q4 163.06
2004 Q3 158.53
2004 Q2 152.92
2004 Q1 146.26
2003 Q4 142.29
2003 Q3 138.41
2003 Q2 134.20
2003 Q1 130.48
2002 Q4 128.58
2002 Q3 126.13
2002 Q2 122.24
2002 Q1 118.00
2001 Q4 116.23
2001 Q3 115.50
2001 Q2 112.69
2001 Q1 109.27
2000 Q4 107.90
2000 Q3 106.33
2000 Q2 103.77
2000 Q1 100.00
1999 Q4 98.29
1999 Q3 97.03
1999 Q2 94.75
1999 Q1 92.08
1998 Q4 90.81
1998 Q3 90.10
1998 Q2 88.30
1998 Q1 85.71
1997 Q4 84.80
1997 Q3 84.37
1997 Q2 83.55
1997 Q1 81.82
1996 Q4 81.18
1996 Q3 81.72
1996 Q2 81.11
1996 Q1 79.61
1995 Q4 79.51
1995 Q3 79.87
1995 Q2 79.28
1995 Q1 77.74
1994 Q4 77.89
1994 Q3 78.23
1994 Q2 78.06
1994 Q1 76.46
1993 Q4 75.91
1993 Q3 76.06
1993 Q2 75.48
1993 Q1 74.46
1992 Q4 74.74
1992 Q3 75.40
1992 Q2 75.48
1992 Q1 74.30
1991 Q4 74.65
1991 Q3 75.16
1991 Q2 74.75
1991 Q1 73.43
1990 Q4 74.59
1990 Q3 75.84
1990 Q2 76.42
1990 Q1 75.58
1989 Q4 75.37
1989 Q3 75.22
1989 Q2 74.40
1989 Q1 72.43
1988 Q4 71.22
1988 Q3 70.50
1988 Q2 69.27
1988 Q1 66.67
1987 Q4 66.18
1987 Q3 65.32
1987 Q2 64.09
1987 Q1 62.03
REAL ESTATE PRICES AND SALES INFORMATION SOURCES
US HEALTH INSURANCE PRICES IN 2010
2010 Average reported annual premiums by coverage type and age >
2010 INDIVIDUAL COVERAGE POLICY PREMIUMS
Overall Average Annual Premium All Ages: $3,606
18-34 Years Old: Not Available
35-49 Years Old: $2,843
50-64 Years Old: $4,822
2010 FAMILY COVERAGE POLICY PREMIUMS
Overall Average Annual Premium All Ages: $7,102
18-34 Years Old: Not Available
35-49 Years Old: $6,864
50-64 Years Old: $8,667
US HEALTH INSURANCE PREMIUMS AVERAGE BY YEAR 2000-2009
SINGLE POLICIES
2009 $4,824
2008 $4,704
2007 $4,479
2006 $4,242
2005 $4,024
2004 $3,695
2003 $3,383
2002 $3,083
2001 $2,689
2000 $2,471
FAMILY POLICIES
2009 $13,375
2008 $12,680
2007 $12,106
2006 $11,480
2005 $10,880
2004 $9,950
2003 $9,068
2002 $8,003
2001 $7,061
2000 $6,438
2009 $4,824
2008 $4,704
2007 $4,479
2006 $4,242
2005 $4,024
2004 $3,695
2003 $3,383
2002 $3,083
2001 $2,689
2000 $2,471
FAMILY POLICIES
2009 $13,375
2008 $12,680
2007 $12,106
2006 $11,480
2005 $10,880
2004 $9,950
2003 $9,068
2002 $8,003
2001 $7,061
2000 $6,438
MONTHLY AVERAGE PRICE OF REGULAR UNLEADED GAS FOR VEHICLES
per gallon of regular unleaded gasoline
Jan. 2011: $3.06
Jan. 2011: $3.06
December 2010: $2.98
November 2010: $2.89
October 2010: $2.84
September 2010: $2.75
August 2010: $2.75
July 2010: $2.73
June 2010: $2.71
May 2010: $2.88
April 2010: $2.87
March 2010: $2.79
February 2010: $2.62
January 2010: $2.74
November 2010: $2.89
October 2010: $2.84
September 2010: $2.75
August 2010: $2.75
July 2010: $2.73
June 2010: $2.71
May 2010: $2.88
April 2010: $2.87
March 2010: $2.79
February 2010: $2.62
January 2010: $2.74
December 2009: 2.59
November 2009: 2.61
October 2009: 2.51
September 2009: 2.57
August 2009: $2.62
July 2009: $2.47
June 2009: $2.62
May 2009: $2.28
April 2009: $2.03
March 2009: $1.86
February 2009: $1.90
January 2009: $1.80
December 2008: $1.62
November 2008: $2.09
October 2008: $2.93
September 2008: $3.62
August 2008: $3.70
July 2008: $4.12 HIGHEST EVER
Source / More
BIANNUAL VEHICLE GAS PRICES FROM 1998
per gallon of regular unleaded gasoline
December 2011: ?
July 2011: ?
December 2010: $2.98
July 2010: $2.73
December 2011: ?
July 2011: ?
December 2010: $2.98
July 2010: $2.73
December 2009: $2.61
July 2009: $2.47
December 2008: $1.62
July 2008: $4.12
December 2007: $3.08
July 2007: $2.90
December 2006: $2.25
July 2006:$2.91
December 2005: $2.10
July 2005: $2.28
December 2004: $1.72
July 2004: $1.88
December 2003: $1.43
July 2003: $1.48
December 2002: $1.29
July 2002: $1.39
December 2001: $1.10
July 2001: $1.30
December 2000: $1.41
July 2000: $1.49
December 1999: $1.25
July 1999: $1.15
December 1998: $0.89
July 1998: $1.04
Source / More